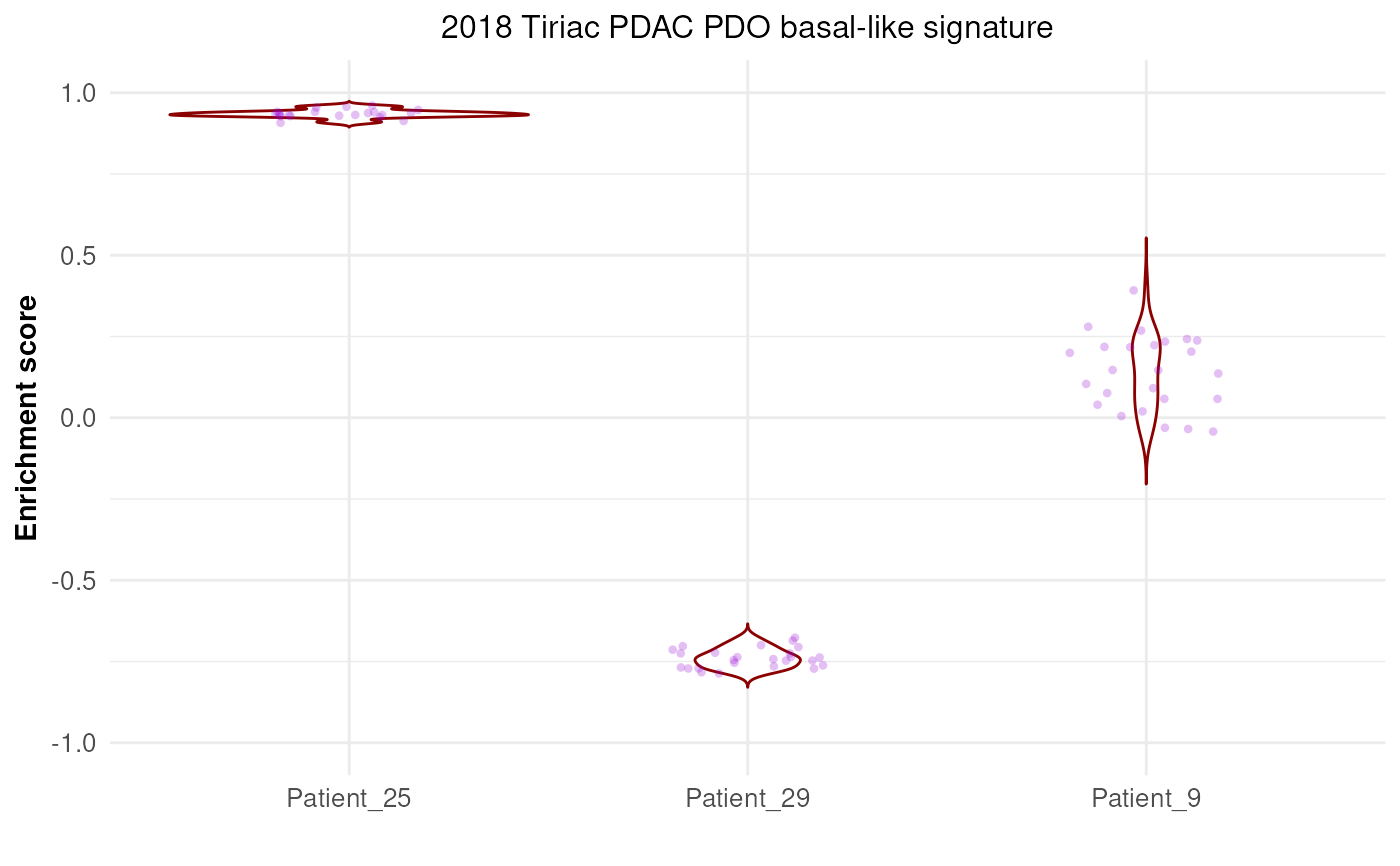
Graph showing both the alternative and the signature distributions obtained for a specific signature
Source:R/externalGraphFunctions.R
plotPermutationSamplesDistribution.RdThe function generates a graph of all the enrichment results obtained during the permutation step for the selected signature and the specified samples. The graph also includes a compact display of the continuous distribution of the values for each sample.
plotPermutationSamplesDistribution(
  x,
  signature,
  samples,
  violinColor = "black",
  pointColor = "black",
  positionJitter = 0.2,
  alpha = 0.25,
  size = 0.95,
  seed = NA
)
Arguments
- x
a
listof class "SplitTypeRdata", the output object fromrunSubtypingfunction, to be graphed.- signature
a
characterstring representing the signature that will be used to create the graph. The signature must be present in the object.- samples
a
listofcharacterstring representing the names of the samples that will be used to create the graph. The samples must be present in the object.- violinColor
a
characterstring representing the color of the line for the kernel density distributions in the graph. Default:"black".- pointColor
a
characterstring representing the color of the dots representing the enrichment scores for the selected samples in the graph. Default:"black".- positionJitter
a
numericrepresenting the amount of vertical and horizontal jitter added to the position of the points on the graph. Default:0.20.- alpha
a
numericrepresenting the amount of the opacity of the points on the graph. IfNA, the color is completely transparent. Default:0.25.- size
a
numericthat represents the size of the points on the graph. Default:0.95.- seed
a
integerthat will be used as seed to make the jitter reproducible. IfNA, the seed is initialized with a random value. Default:NA.
Value
a ggplot object that contains all the enrichment scores
obtained through the permutation step with the kernel desntiy distributions
for the selected samples and the selected signature.
Examples
## Loading signatures
data("signaturesDemo")

## Load demo normalized expected counts for 30 patients
data("expNormalCountsDemo")

## Fix seed for reproducibility
set.seed(1221)

## Run classification on the 30 patients using 20 permutations on 75% of
## the dataset, and 10 points per patient for the up-scaling step
results <- runSubtypingBimodal(geneLists=signaturesDemo,
    expectedCountsMatrix=expNormalCountsDemo,
    permRatio=0.75, permNbr=30, upscaleNbr=5)

## Graph the enrichment results from the permutation for 3 samples
plotPermutationSamplesDistribution(x=results,
    signature="Basal-like",
    samples=c("Patient_9", "Patient_25", "Patient_29"),
    violinColor="darkred", pointColor="darkviolet", positionJitter=0.20,
    size=1.2, seed=121)