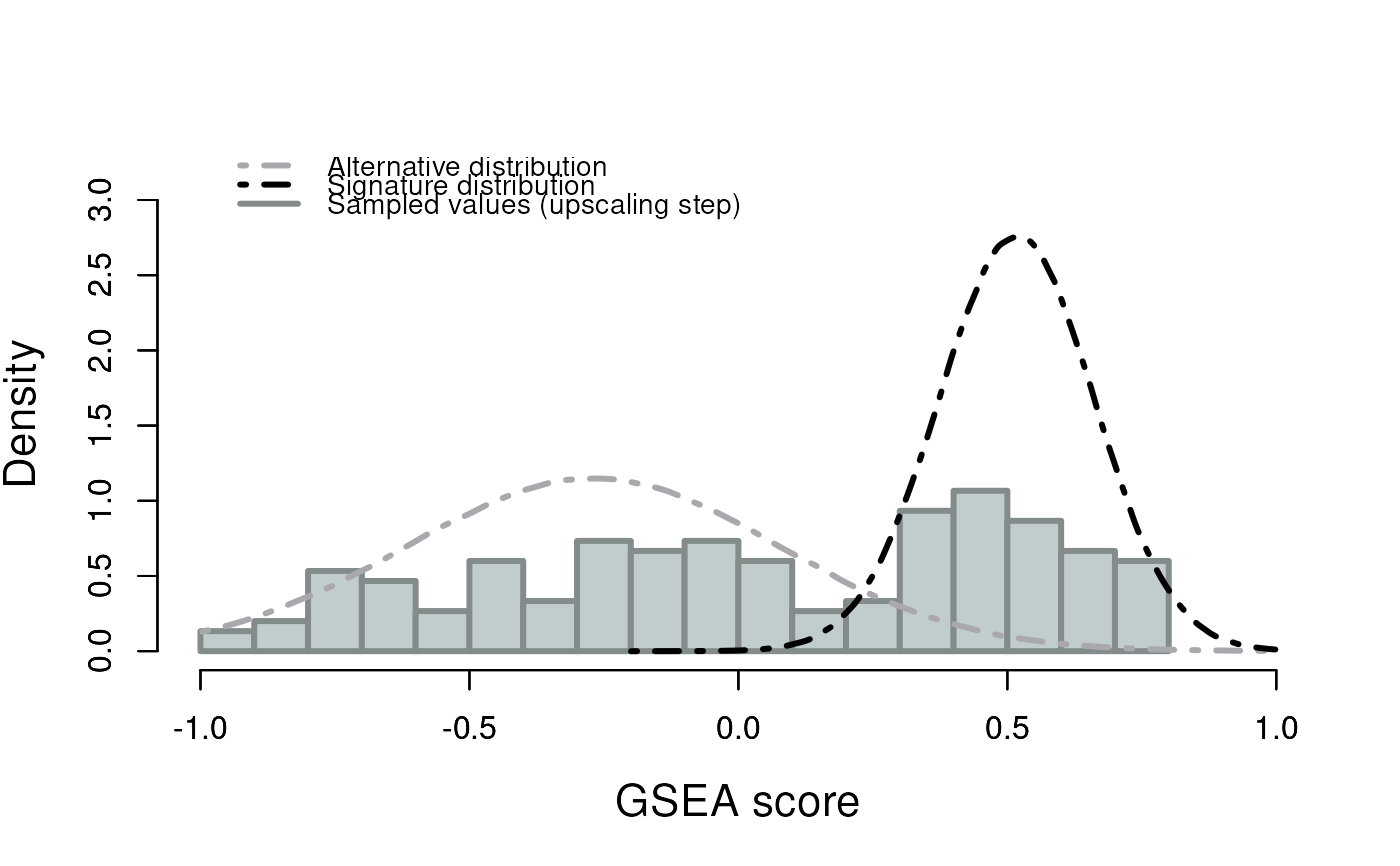
Graph both the alternative and the signature distributions obtained for a specific signature
Source:R/externalGraphFunctions.R
plotDensityWithUpscalingSamplesBimodal.RdThe function generates a graph showing the signature and alternative distributions obtained from the upscaling step followed by the extraction of the mixture of two normal distributions for each selected signature. The graph also contains the histogram of the enriched scores for the upscaled dataset (not the original dataset).
plotDensityWithUpscalingSamplesBimodal(
  x,
  signature,
  breaks = 22L,
  colorSignature = "black",
  colorAlternative = "#A9A9AD",
  colorBorderSamples = "azure4",
  colorFillingSamples = "azure3"
)
Arguments
- x
a "SplitTypeRdata" object, the output object from
runSubtypingfunction, to be graphed.- signature
a
characterstring representing the signature that will be used to create the graph. The signature must be present in the object.- breaks
a single
integervalue giving the number of cells for the histogram,- colorSignature
a
characterstring representing the color of the signature distribution curve. Default:"black".- colorAlternative
a
characterstring representing the color of the alternative distribution curve. Default:"#A9A9AD".- colorBorderSamples
a
characterstring representing the color of the histogram border for the sample distribution. Default:"azure4".- colorFillingSamples
a
characterstring representing the color of the histogram filling for the sample distribution. Default:"azure3".
Value
NULL, invisibly. The function is called for its side
effect: a histogram of the values generated during the upscaling step,
with the two normal distributions of the mixture model, is drawn on the
current graphics device.
Examples
## Loading signatures
data("signaturesDemo")

## Load demo normalized expected counts for 30 patients
data("expNormalCountsDemo")

## Fix seed for reproducibility
set.seed(1221)

## Run classification on the 30 patients using 20 permutations on 75% of
## the dataset, and 10 points per patient for the up-scaling step
results <- runSubtypingBimodal(geneLists=signaturesDemo,
    expectedCountsMatrix=expNormalCountsDemo,
    permRatio=0.75, permNbr=20, upscaleNbr=5)

## Graph result
plotDensityWithUpscalingSamplesBimodal(x=results,
    signature="Classical")