The result of an enrichment analysis has been done using the significantly differentially expressed genes between napabucasin treated and DMSO control parental MiaPaCa2 cells. The cells were treated for 2 hour with 0.5 uM napabucasin. The protocol to generate the RNA-seq is described in Froeling F.E.M. et al 2019.
Source:R/enrichViewNet.R
parentalNapaVsDMSOEnrichment.RdThe enrichment analysis was done with gprofile2 package (Kolberg L et al 2020) with database version 'e109_eg56_p17_1d3191d' and g:SCS multiple testing correction method applying significance threshold of 0.05 (Raudvere U et al 2019). All tested genes were used as background.
Usage
data(parentalNapaVsDMSOEnrichment)Format
a list created by gprofiler2 that contains the results
from the enrichment analysis:
"result": adata.framewith the significantly enriched terms"meta": alistwith the meta-data information
Source
The original RNA-sequencing data is available at the Gene Expression Omnibus (GEO) under the accession number GSE135352.
Value
a list containing 2 entries:
"result": adata.framewith the significantly enriched terms"meta": alistwith the meta-data information
Details
The object is a named list with 2 entries. The 'result' entry
contains a data.frame with the enrichment analysis results and
the 'meta' entry contains metadata information.
The dataset used for the enrichment analysis is associated to this publication:
Froeling F.E.M. et al.Bioactivation of Napabucasin Triggers Reactive Oxygen Species–Mediated Cancer Cell Death. Clin Cancer Res 1 December 2019; 25 (23): 7162–7174
The enrichment analysis has been done with gprofile2 package (Kolberg L et al 2020) with database version 'e109_eg56_p17_1d3191d' and g:SCS multiple testing correction method applying significance threshold of 0.05 (Raudvere U et al 2019). All tested genes were used as background.
See also
createNetwork for transforming functional enrichment results from gprofiler2 into a Cytoscape network
createEnrichMap for transforming functional enrichment results from gprofiler2 into an enrichment map
createEnrichMapAsIgraph for transforming functional enrichment results from gprofiler2 into an enrichment map in a igraph format
Examples
## Loading dataset containing the results of the enrichment analysis
## done on a differentially expressed
## analysis between 2-hour treatment with 0.5 uM napabucasin and
## DMSO vehicle control parental MiaPaCa2 cells
data(parentalNapaVsDMSOEnrichment)
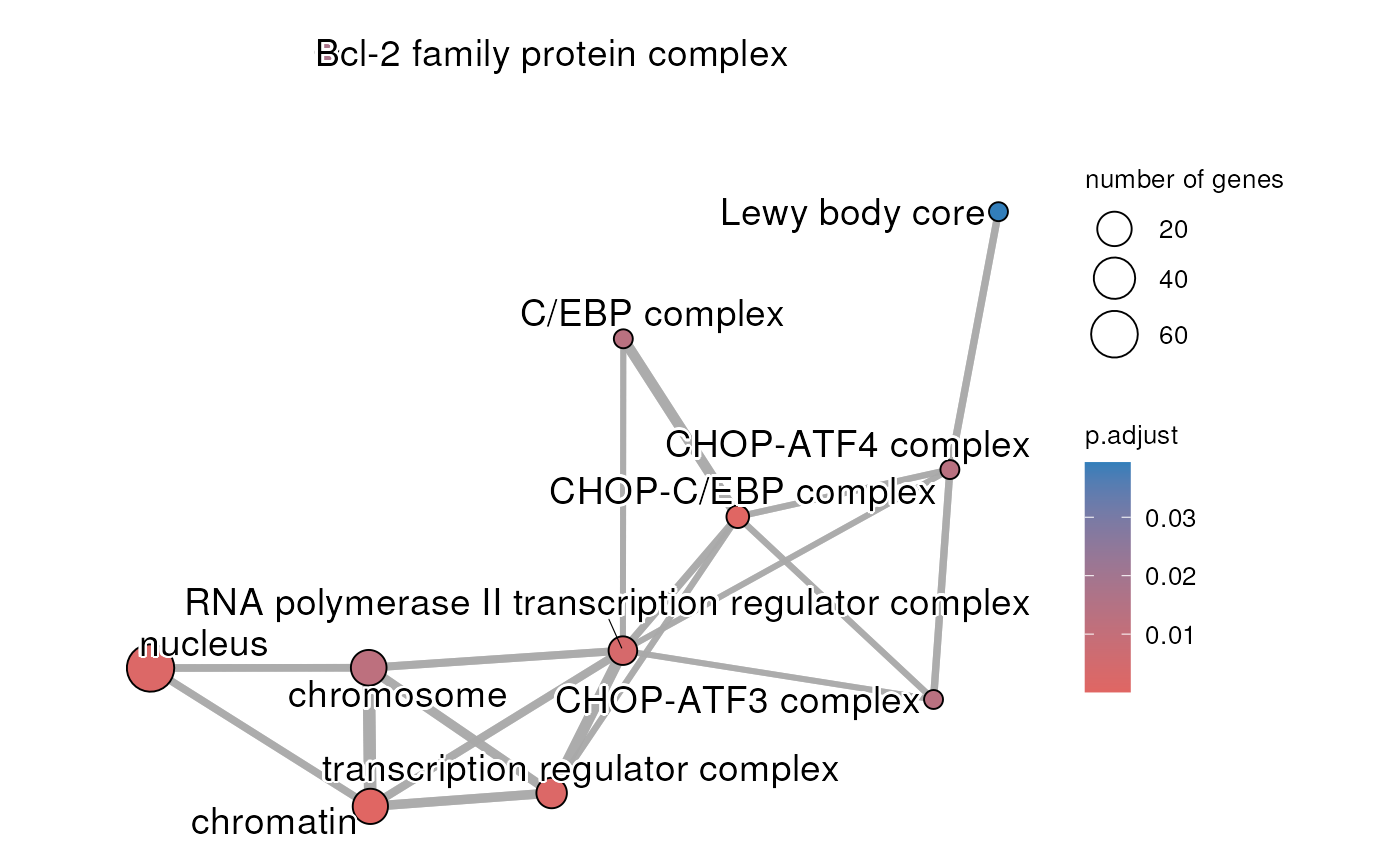
## Create an enrichment map for the GO:CC terms
createEnrichMap(gostObject=parentalNapaVsDMSOEnrichment,
query="parental_napa_vs_DMSO", source="GO:CC")