Using functional enrichment results in gprofiler2 format to create an enrichment map with multiple groups from different enrichment analyses
Source:R/methodsEmap.R
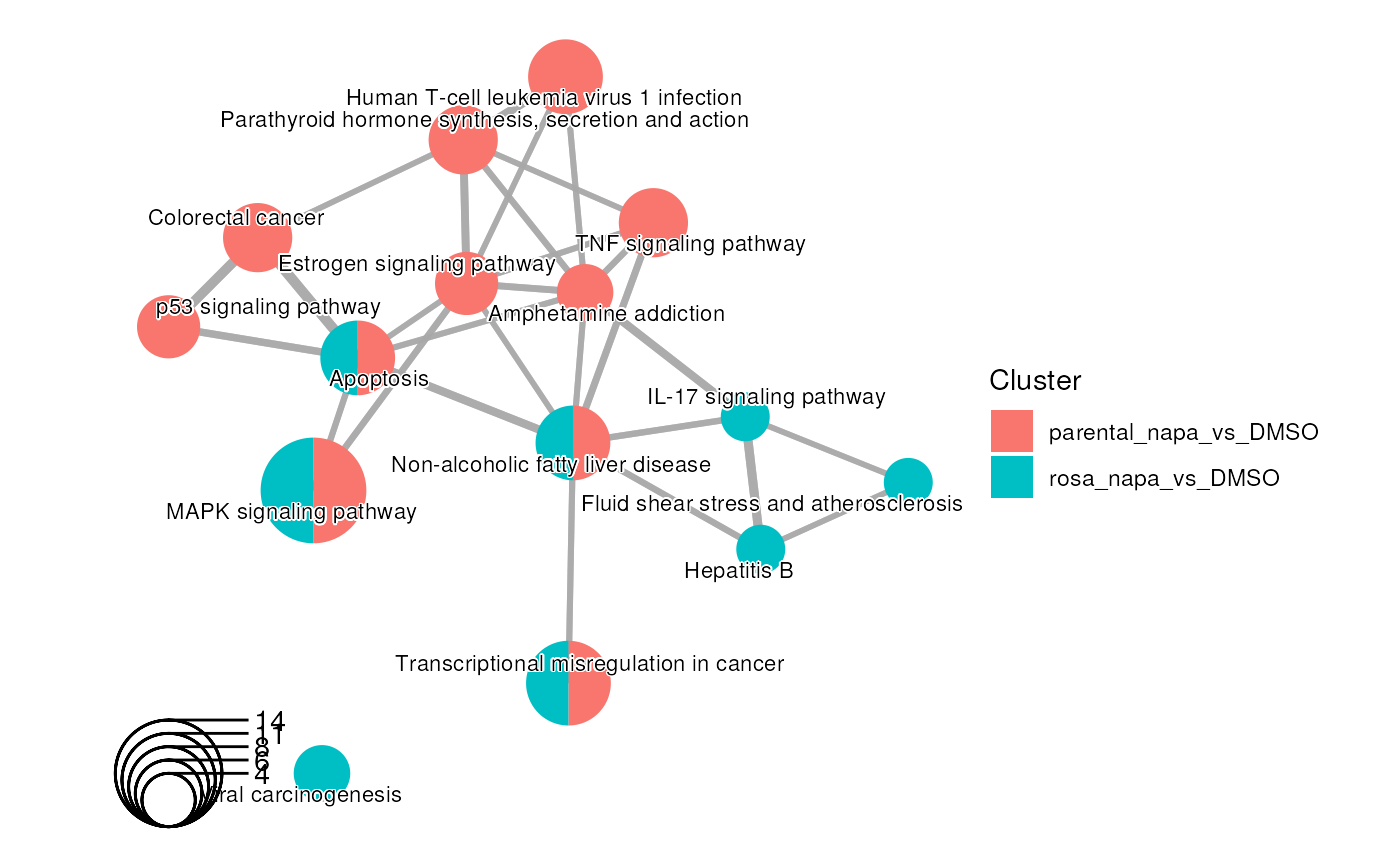
createEnrichMapMultiBasic.RdUser selected enrichment terms are used to create an enrichment map. The selection of the term can by specifying by the source of the terms (GO:MF, REAC, TF, etc.) or by listing the selected term IDs. The map is only generated when there is at least on significant term to graph.
Usage
createEnrichMapMultiBasic(
  gostObjectList,
  queryList,
  source = c("TERM_ID", "GO:MF", "GO:CC", "GO:BP", "KEGG", "REAC", "TF", "MIRNA", "HPA",
    "CORUM", "HP", "WP"),
  termIDs = NULL,
  removeRoot = TRUE,
  showCategory = 30L,
  categoryLabel = 1,
  categoryNode = 1,
  line = 1,
  ...
)
Arguments
- gostObjectList
a
listofgprofiler2objects that contain the results from an enrichment analysis. The list must contain at least 2 entries. The number of entries must correspond to the number of entries for thequeryListparameter.- queryList
a
listofcharacterstrings representing the names of the queries that are going to be used to generate the graph. The query names must exist in the associatedgostObjectListobjects and follow the same order. The number of entries must correspond to the number of entries for thegostObjectListparameter.- source
a
characterstring representing the selected source that will be used to generate the network. To hand-pick the terms to be used, "TERM_ID" should be used and the list of selected term IDs should be passed through thetermIDsparameter. The possible sources are "GO:BP" for Gene Ontology Biological Process, "GO:CC" for Gene Ontology Cellular Component, "GO:MF" for Gene Ontology Molecular Function, "KEGG" for Kegg, "REAC" for Reactome, "TF" for TRANSFAC, "MIRNA" for miRTarBase, "CORUM" for CORUM database, "HP" for Human phenotype ontology and "WP" for WikiPathways. Default: "TERM_ID".- termIDs
a
vectorofcharacterstrings that contains the term IDS retained for the creation of the network. Default:NULL.- removeRoot
a
logicalthat specified if the root terms of the selected source should be removed (when present). Default:TRUE.- showCategory
a positive
integeror avectorofcharactersrepresenting terms. If ainteger, the firstnterms will be displayed. Ifvectorof terms, the selected terms will be displayed. Default:30L.- categoryLabel
a positive
numericrepresenting the amount by which plotting category nodes label size should be scaled relative to the default (1). Default:1.- categoryNode
a positive
numericrepresenting the amount by which plotting category nodes should be scaled relative to the default (1). Default:1.- line
a non-negative
numericrepresenting the scale of line width. Default:1.- ...
additional arguments that will be pass to the
emapplotfunction.
Examples
## Loading dataset containing results from 2 enrichment analyses done with
## gprofiler2
data(parentalNapaVsDMSOEnrichment)
data(rosaNapaVsDMSOEnrichment)

## Extract query information (only one in each dataset)
query1 <- unique(parentalNapaVsDMSOEnrichment$result$query)[1]
query2 <- unique(rosaNapaVsDMSOEnrichment$result$query)[1]

## Create graph for KEGG related results from
## 2 enrichment analyses
createEnrichMapMultiBasic(gostObjectList=list(parentalNapaVsDMSOEnrichment,
    rosaNapaVsDMSOEnrichment),
    queryList=list(query1, query2), source="KEGG", removeRoot=TRUE)
#> Coordinate system already present.
#> ℹ Adding new coordinate system, which will replace the existing one.