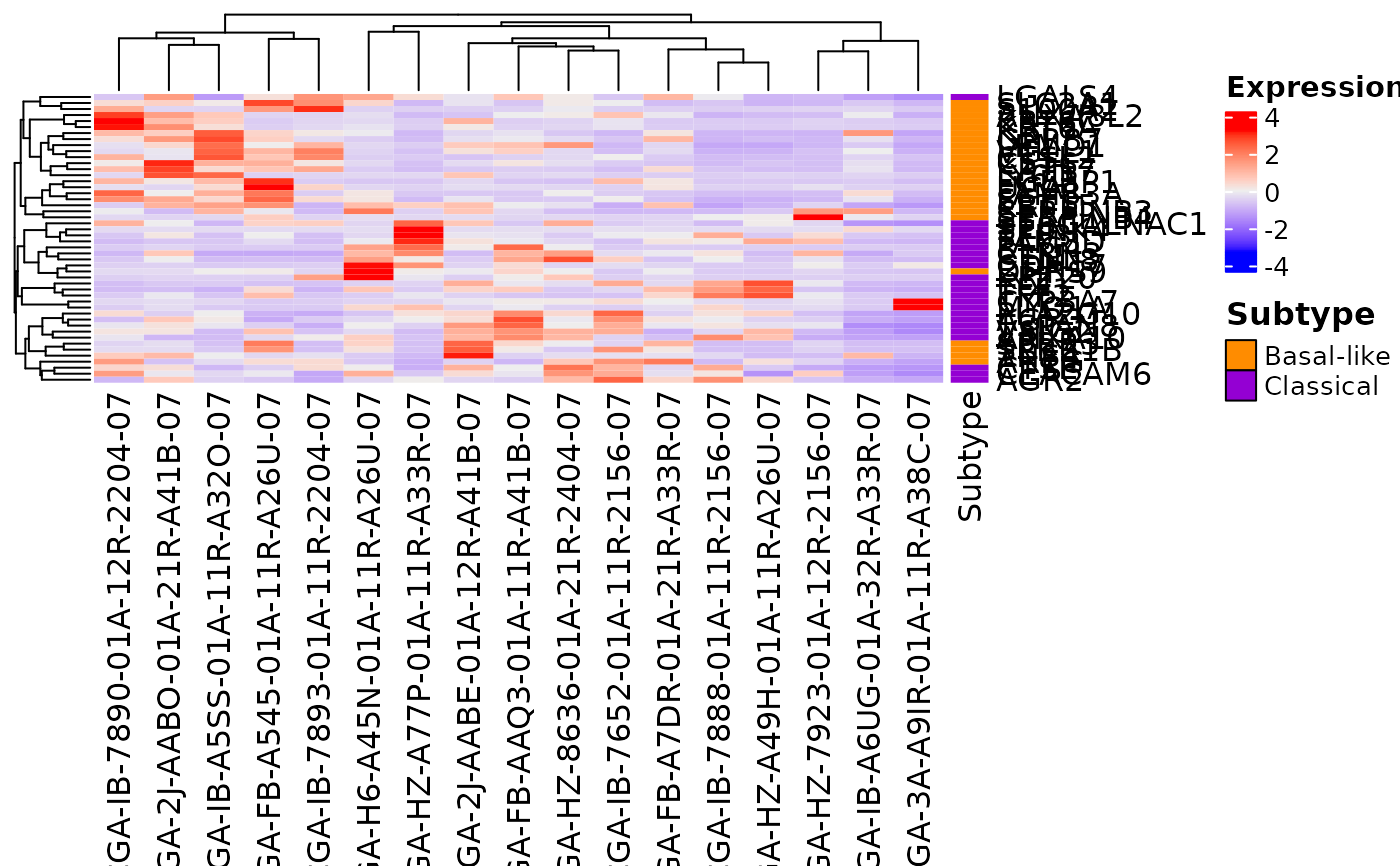
Generate a heatmap based on transcriptomic data for a basal-like/classical gene list
Source:R/Heatmap.R
createHeatmap.RdThe function selects the expression values related to the gene list passed in argument. Then, the function adds one to the expression values before log transforming the values. Then, the function normalizes the data so that each row has mean 0 and variance 1. Finally, the function generates a heatmap using input parameters.
createHeatmap(
  gene_list,
  rna_data,
  gene_column = "GENE",
  name = "Expression",
  clustering_distance_rows = c("euclidean", "maximum", "manhattan", "canberra",
    "binary", "minkowski", "pearson", "spearman", "kendall"),
  clustering_distance_columns = c("euclidean", "maximum", "manhattan", "canberra",
    "binary", "minkowski", "pearson", "spearman", "kendall"),
  show_column_dend = TRUE,
  show_row_dend = TRUE,
  cluster_columns = TRUE,
  cluster_rows = TRUE,
  log_data = TRUE,
  heatmap_legend_param = gpar(title_gp = gpar(col = "black", fontsize = 11, fontface =
    "bold")),
  ...
)
Arguments
- gene_list
a
data.framecontaining the gene list used for the basal-like/classical classification. Thedata.framemust contain two columns:SYMBOLandClass. TheSYMBOLcontains the gene symbol while theClasscolumn contains its classification. The classification can beClassicalorBasal-like.- rna_data
data.framecontaining the expression level for the samples. Each column must represent a sample. An extra column for the gene name must be present. The name of this column must correspond to the parametergene_column.- gene_column
a
characterstring representing the name of the column in therna_dataparameter that contains the gene names. Default:GENE.- name
a
characterstring representing the title of the heatmap legend. Default:"Expression".- clustering_distance_rows
a
characterstring representing the method uses to cluster the rows of the heatmap. The available choices are: "euclidean", "maximum", "manhattan", "canberra", "binary", "minkowski", "pearson", "spearman" and "kendall". Default:"euclidean".- clustering_distance_columns
a
characterstring representing the method uses to cluster the columns of the heatmap. The available choices are: "euclidean", "maximum", "manhattan", "canberra", "binary", "minkowski", "pearson", "spearman" and "kendall". Default:"euclidean".- show_column_dend
a codelogical indicating if the column dendrogram should be shown. Default:
TRUE.- show_row_dend
a codelogical indicating if the row dendrogram should be shown. Default:
TRUE.- cluster_columns
a codelogical indicating if the columns should be clustered. Default:
TRUE.- cluster_rows
a codelogical indicating if the rows should be clustered. Default:
TRUE.- log_data
a
logicalindicating if the data should be log transformed. If so, the data will be log2(value + 1) transformed. Default:TRUE.- heatmap_legend_param
an object of class '
gpar'. Default:gpar(title_gp=gpar(col="black", fontsize=11, fontface="bold")).- ...
further arguments passed to ComplexHeatmap::Heatmap() function.
Value
an object of class ComplexHeatmap that represent a heatmap based on transcriptomic data for a specific basal-like/classical gene list.
See also
The default method ComplexHeatmap::Heatmap().