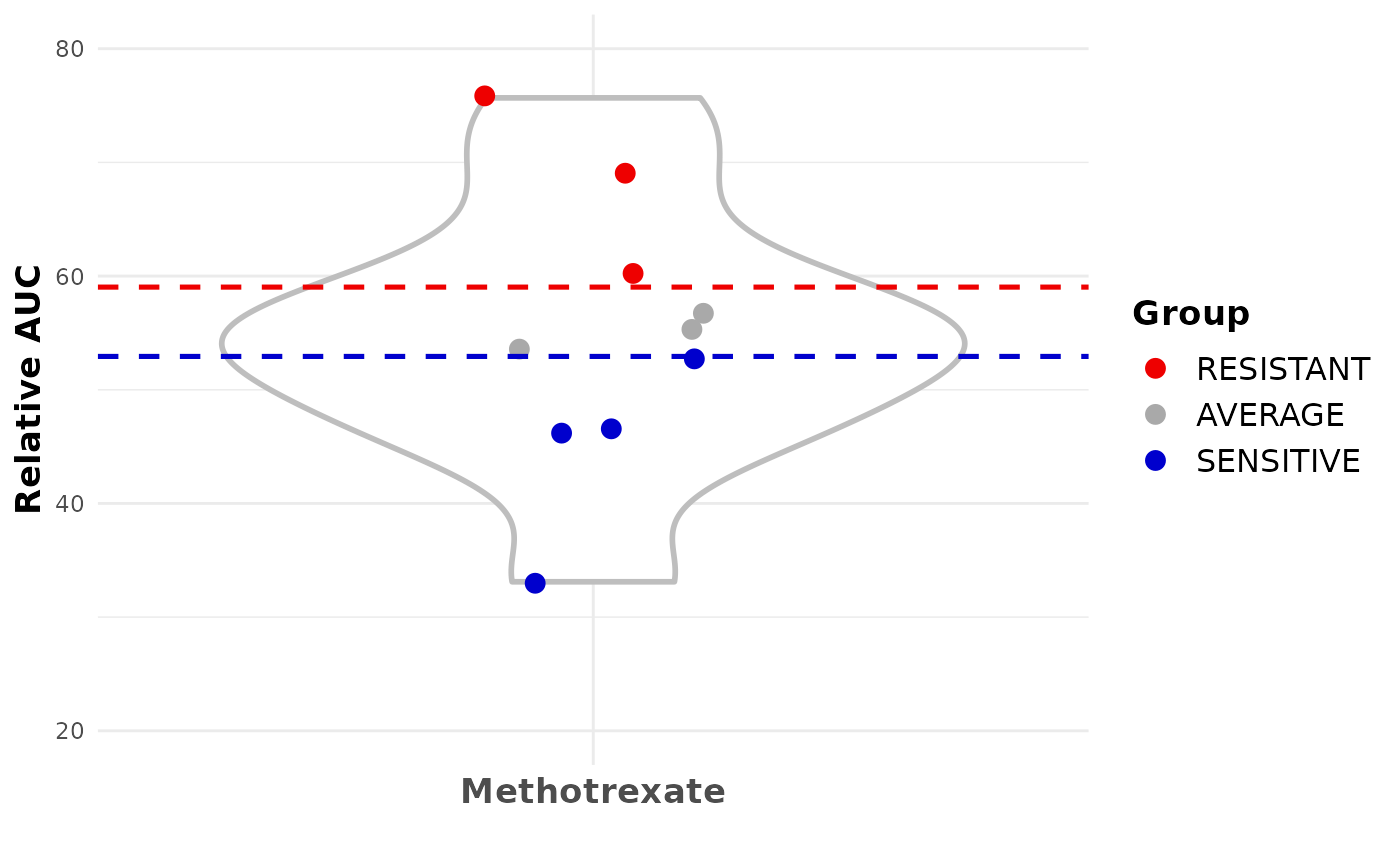
Create a violin plot using the relative AUC and the sensitivity classes (SENSITIVE, AVERAGE, RESISTANT) of the organoids for a specific drug.
Source:R/drugScreening.R
plotDrugAUCViolinPlot.RdThe function generates a violin plot using the relative AUC
and the sensitivity class information present in a DrugAUCQuantile"
object. The function uses [ggplot2::ggplot][ggplot2::ggplot()] function and
returns a "ggplot" object. The violin tails of the violins can be
trimmed to the range of the data.
plotDrugAUCViolinPlot(drugQuantile, min = 0, max = 100, trim = FALSE)Arguments
- drugQuantile
an object of class "
DrugAUCQuantile" which contains the sensitive and resistant organoids for a specific drug.- min
a single
numericrepresenting the minimum value of the y-axis. Default:0.- max
a single
numericrepresenting the maximum value of the y-axis. The maximum value must be superior to the minimum value. Default:100.- trim
a
logicalindicating if the tails of the violins are trimmed to the range of the data. Default:FALSE.
Value
a ggplot object for a violin plot built with the specified
data.
Examples
## Load drug screen dataset for 1 drug
data(drugScreening)

## Calculate the extreme organoids for the methotrexate drug screening
## using a quantile of 1/3
results <- getClassOneDrug(drugScreening=drugScreening,
    drugName="Methotrexate", study="MEGA-TEST", screenType="TEST-01",
    doseType="Averaged", quantile=1/3)

## Plot results
p <- plotDrugAUCViolinPlot(drugQuantile=results, min=20, max=80, trim=TRUE)
plot(p)
#> Warning: Removed 1 rows containing non-finite values (stat_ydensity).
#> Warning: Removed 1 rows containing missing values (geom_point).